Five Tools That Help You Create Awesome Charts and Infographics
Let’s face it: visual content is hotter than ever on the web. And since people’s attention span gets lower each year, it is quite clear that movies and data presented in an attractive form are here to stay. Let us take a look at five tools that will help you become a great designer without having to go to art school.
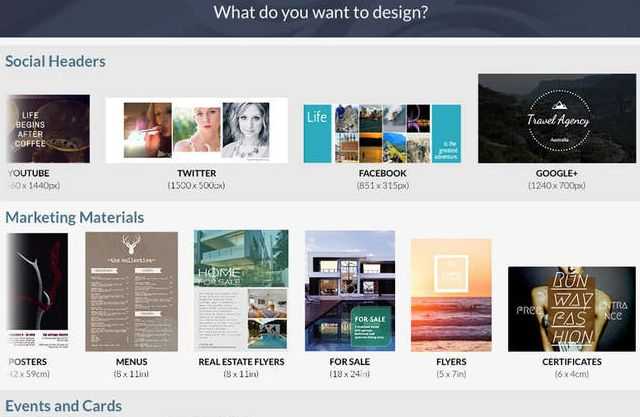
The first tool on our list is Desygner. According to its creators, it is supposed to help you design professional graphics within minutes. And, believe it or not, it looks like the product actually lives up to its promise. Desygner supports a large array of graphics templates that range from social posts, web adverts, e-mail and blog templates, social headers, events and cards, marketing materials, and the list goes on. The online app comes with many templates, so you will never have to start from scratch. And if you need fresh ideas for your children’s party, for example, you will be glad to find out that Desygner also includes a “fun” section, which will allow you to easily create “Best Mom Awards” certificates and “Most Wanted” posters, for example.
Snappa brands itself as “everything you can ask from a graphic design tool”. It comes with over 10,000 photos and patterns, over 3000 shapes, and over 200 fonts and typefaces. Snappa helps you get started fast with your projects, because it has hundreds of predesigned templates for blog posts, social media posts, newsletters, and ad networks. And to help you save time, the app makes sure that each image type is fully optimized for social media. If you think that 10,000 photos aren’t enough, you will be pleased to find out that the app creators add new photos to the library each day. An interesting feature allows you to schedule your image posts on the main social media sites by making use of Buffer’s power scheduler.
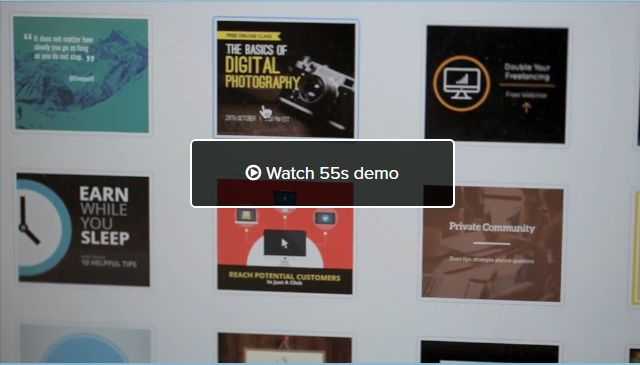
Canva has an impressive set of features that make it easy to convert your ideas into great looking charts and designs. It integrates with various third party graphics libraries, allowing you to add them to your own projects. But Canva can also work with your own images, of course, and it’s got several tools that will make your life much easier. We have been impressed with its photos straightener, which allows you to rotate poorly taken images and see the rotation effect in real time. Canva’s image cropper will not only help you crop images, but will also allow you to add great frames and other graphics elements to them. Many online tools help you add text to your photos, but Canva also incorporates speech bubbles, helping you add dialogs to your pictures within seconds.
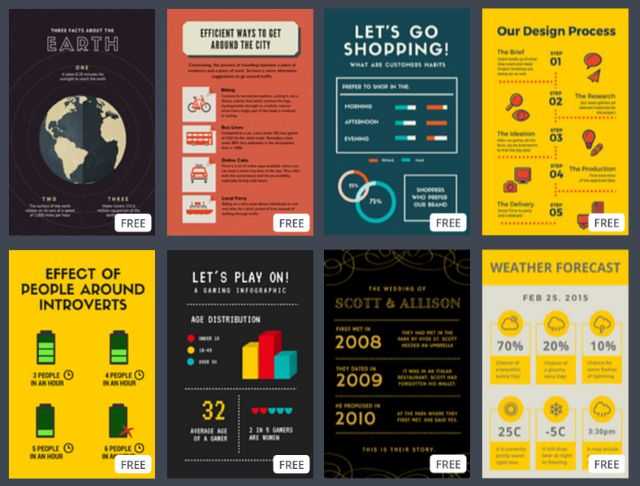
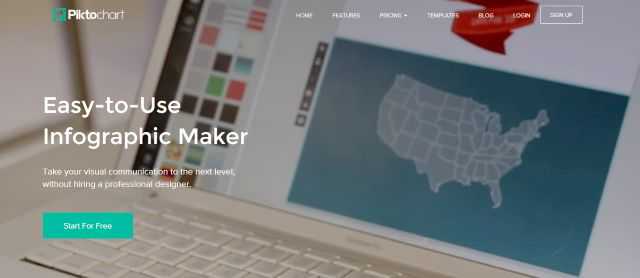
Piktochart is an online graphics editor that takes drag-and-drop and point-and-click to the next level. Piktochart comes with a library of over 400 professionally designed templates, which will help you create banners, charts, reports, presentations, and a vast selection of infographics. The app’s image library comes with over 4,000 images and icons, and incorporates lots of ready to use text frames and photo frames. We are all about charts here at ChartBurst, of course, so we were excited to find out that Piktochart can import data straight from spreadsheets, no matter if they are created by Microsoft’s or Google’s tools.
The last app on our list is Prezi, and its main goal is to make it easy to create beautiful presentations. It’s also got the ability of importing PowerPoint slides into your presentation, of course. In fact, you could create your entire presentation in PowerPoint, and then use Prezi to beautify it. You can also embed videos, either from your computer or YouTube, or add sound and narration, making your presentation more powerful by using a dynamic soundtrack. You can also have an entire team working at the same presentation online, due to Prezi’s fantastic cooperation abilities.
These are some of the best charts and infographics makers that are available online today. Watch this space, because we may add more fantastic charts / graphics / infographics maker tools as we discover them.


